MATH
LOCKER QUESTION
100 students are assigned lockers, numbered 1 through 100. The students are assigned to lockers number 1 opens all 100 lockers. The student assigned to locker number 2 then closes their own locker, and every second locker after that. The student assigned to locker number 3 starts with their own locker and changes the status for every third locker after that (opens a locker if it is closed; closes a locker if it is open). The student with locker number four begins with their locker, changing the status of their won and every fourth locker after that. This continues for all 100 students.
After all 100 students, which lockers will be shut and which will be open?
OCTOBER: DATA MANAGEMENT & MEASURMENT
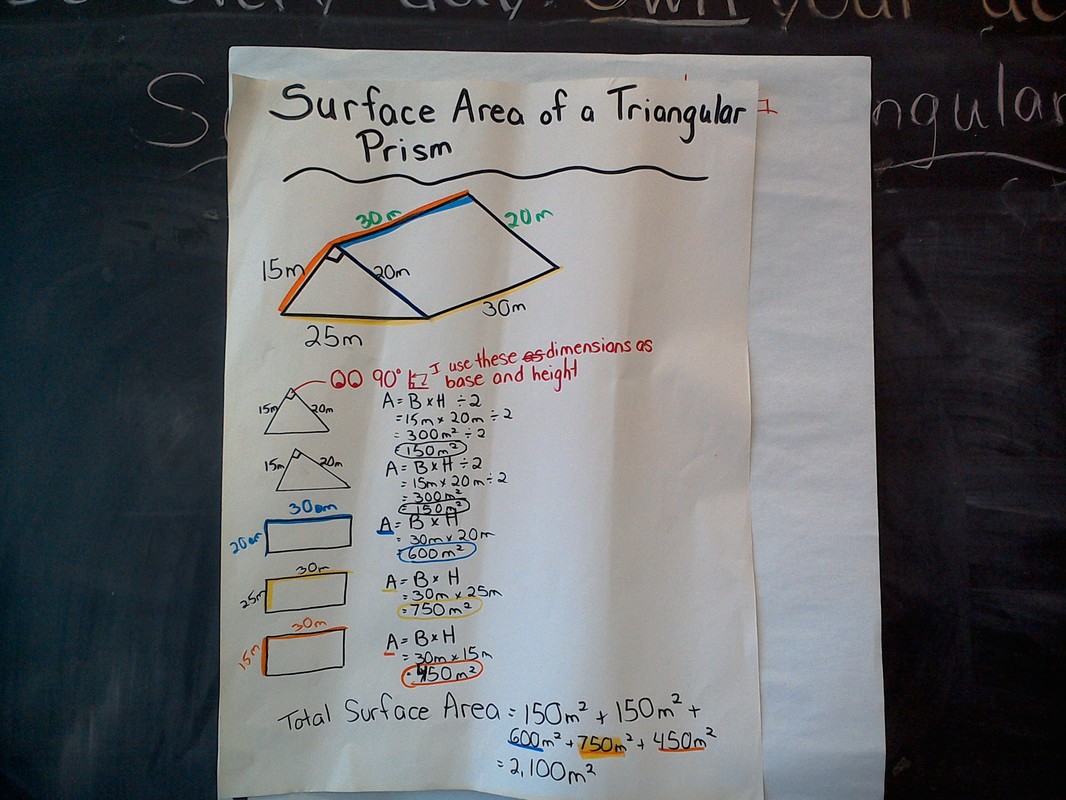
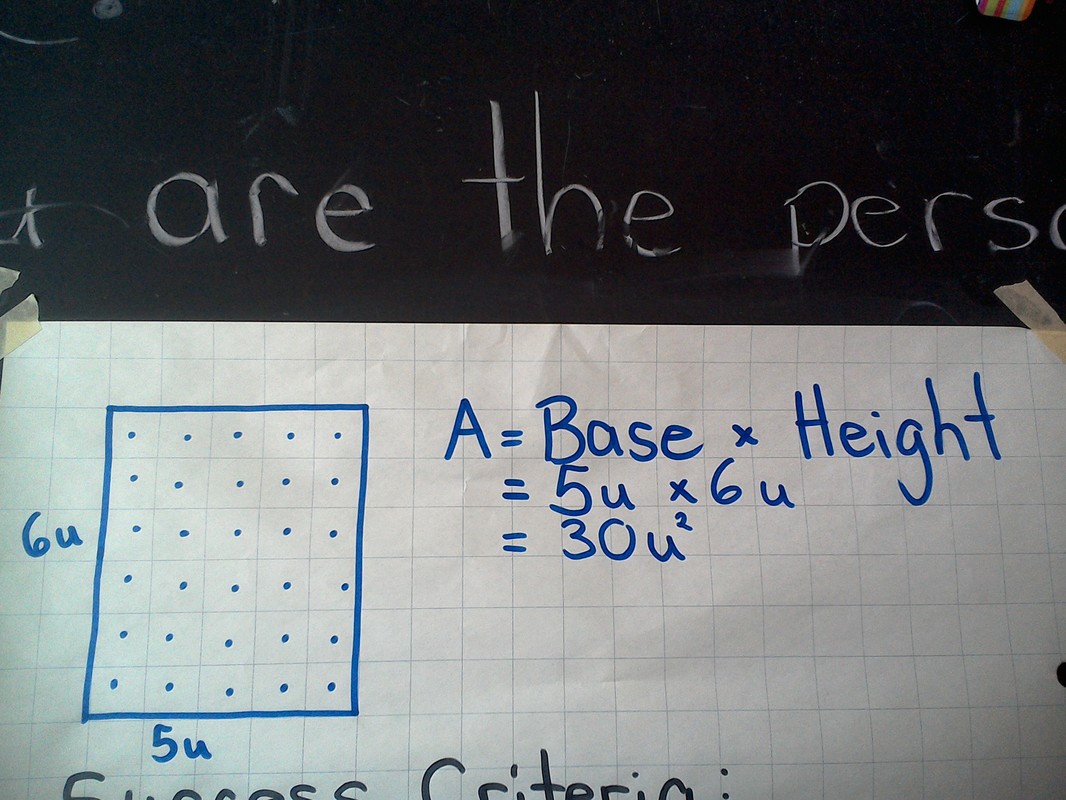
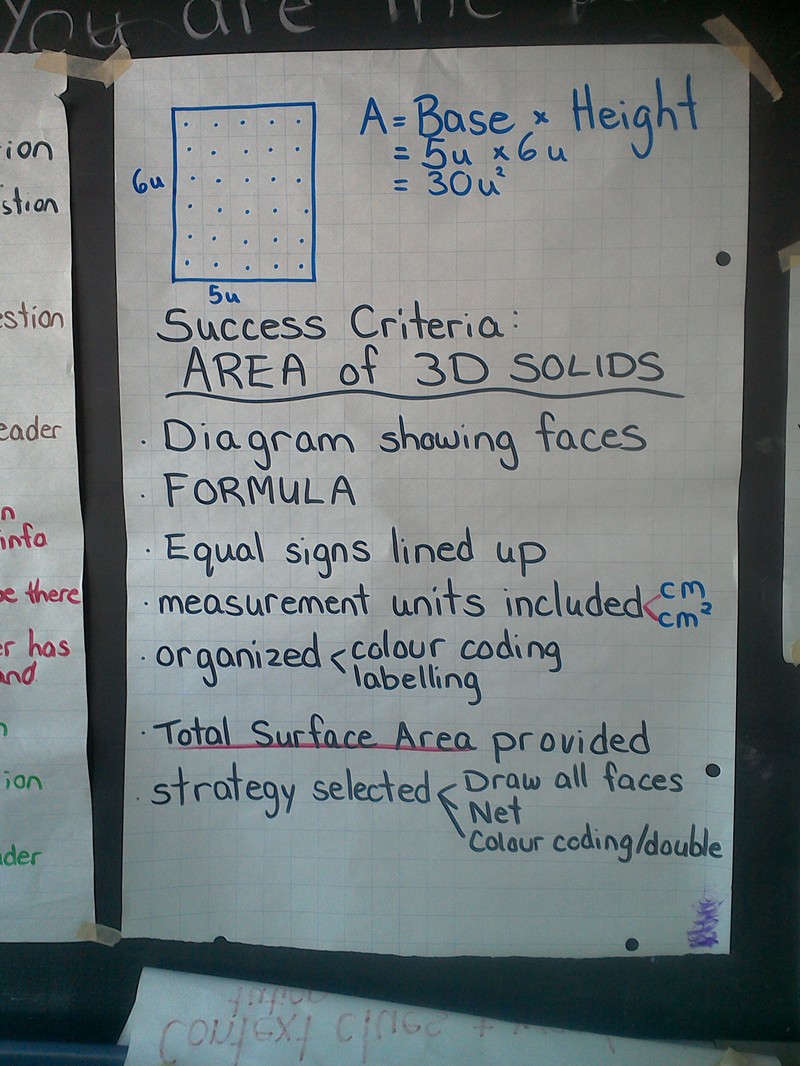
MEASURMENT: We are exploring the metric system and working on metric conversions. This uses the same skill as the Place Value Chart, where numbers increase by x10 or decrease by divide 10 each time you move one column.
DATA MANAGMENT: Students are exploring different types of graphs and identifying which type of graph should be used based on the data provided. Students are researching in math textbooks and online to identify the purpose, use, characteristics and to provide a sample. Here is our note, and a quick example for a pictograph:
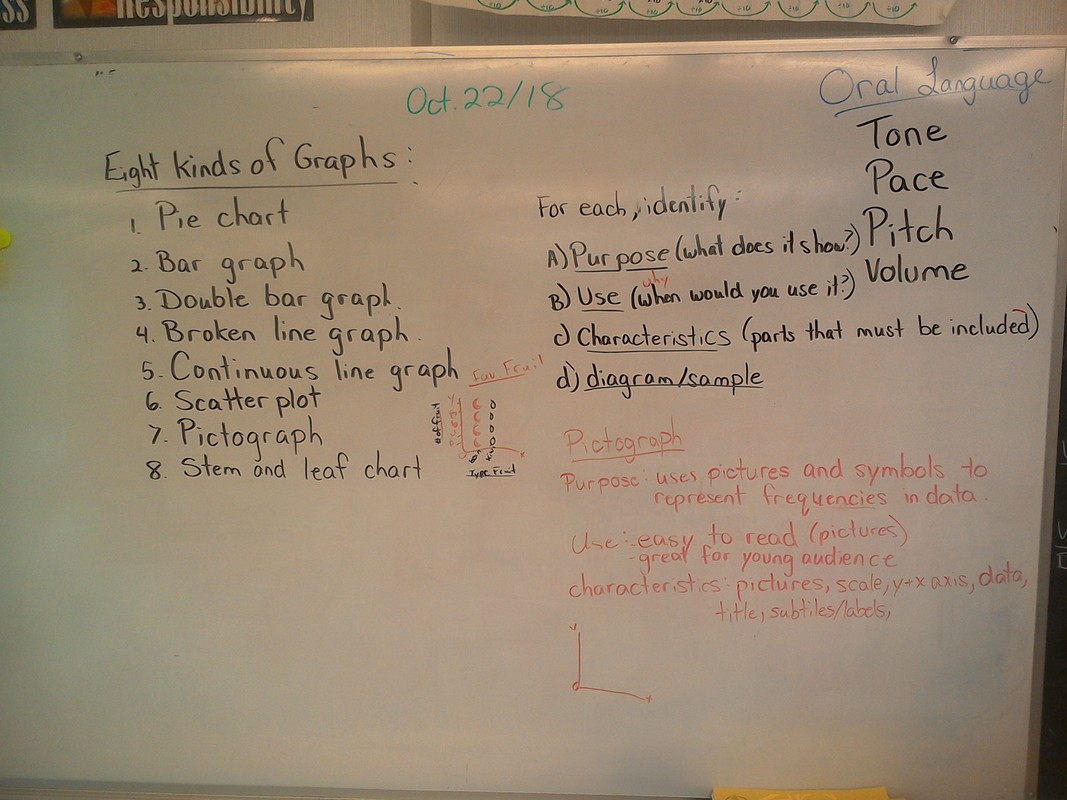
UPCOMING IN MATH: Data management terms! Including: primary data, secondary data, discrete data, continuous data, mean, median, mode, range, scale, upward trend, downward trend.
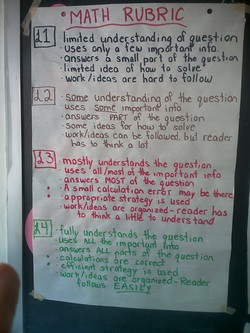
MATH RUBRIC
Students should be review their work to see what has been done well, and what could be improved.
Students should be review their work to see what has been done well, and what could be improved.
|
|
|